GC
ES
NQ
ORDER FLOW · GEX LEVELS
What it shows
Order flow data and GEX levels.
GCESNQ
What you get
Three things, live all session.
/01
Live GEX levels
Updated every hour, straight from the options book, during the New York session.
/02
Live order flow
Read off the tape in real time and simplified onto the chart.
/03
Moving pivot levels
With LVN, POC and HVN marked as they shift through the session, and each level rated strong or weak.
A session
Set before the open, live until the close.
PRE-OPEN
Levels are set
GEX levels carried in from the previous session, pivots drawn before the bell.
SESSION
Order flow runs live
The tape is read as it prints and simplified onto the chart, hour by hour.
CLOSE
Levels reset
Pivots and value areas are redrawn from the session that just finished.
Track record
Funded accounts, paid out.
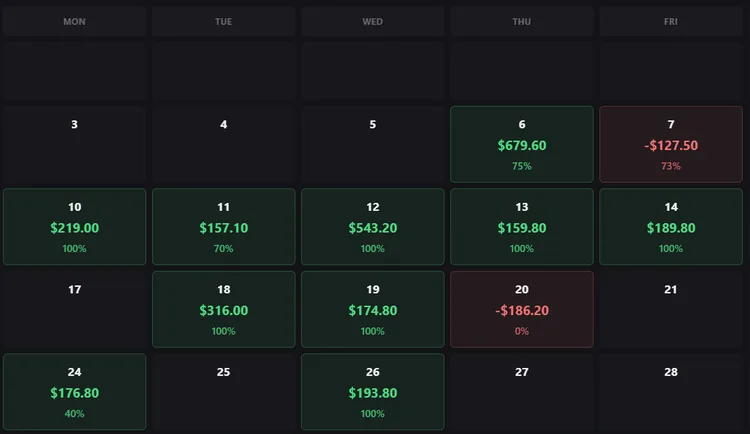
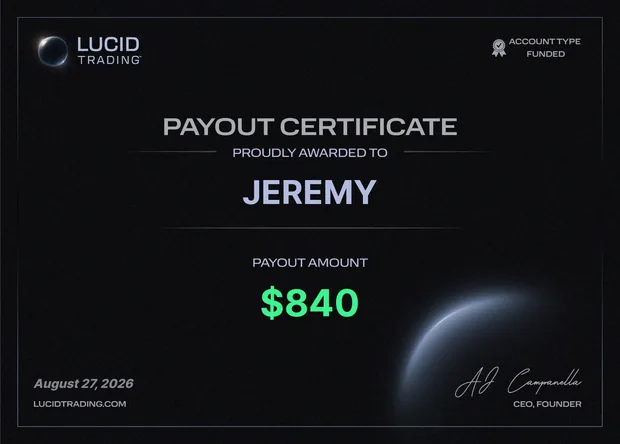
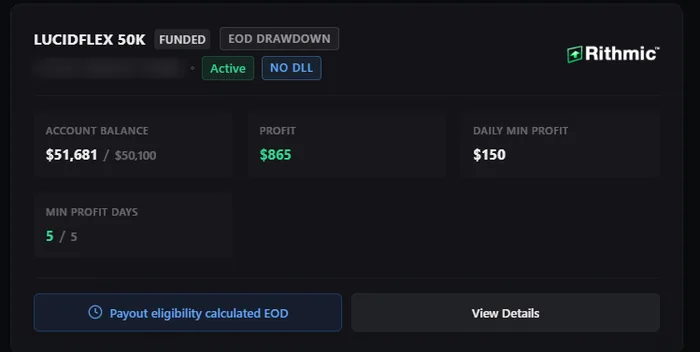
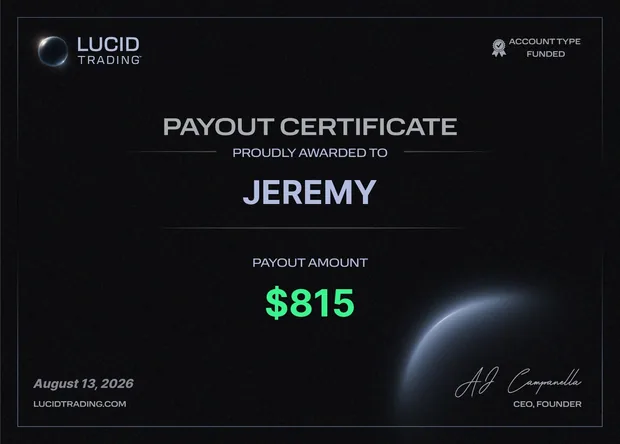
Screenshots from the developer’s own funded accounts. A record of past sessions, not a projection — individual results vary, and nothing here claims the dashboard produces profits.
Access
One plan. Monthly, or week by week.
SINGLE TIER
FOUNDING · FIRST 25
BETA
$115
$69
/ month
FOUNDING PRICE · 40% OFF
$25
/ week
ONE WEEK AT A TIME · NO MONTHLY COMMITMENT
IN BETA
The dashboard runs live every session, but features are still changing and you should expect occasional downtime.
Founding price for the first 25 members, locked in while you stay subscribed
Regular price after that: $115 a month
All three instruments, one seat
7-day free trial, then monthly or a week at a time
Payment and access via Whop
Included
Live GEX levels, refreshed hourly through the New York session
Live order flow, read off the tape and drawn on the chart
Moving pivot levels, with LVN, POC and HVN, rated strong or weak
GC, ES and NQ, all session. Nothing to configure.
On the chart
What it looks like across a full session.
TAP ANY CHART TO ENLARGE
Order flow
Every detection explains itself
NQ · 5M · FLOW + DELTA
Hover a marker and it says what happened: which side was in control, the pattern, the price and the level it printed at. Delta and cumulative delta run underneath.
Across markets
Four charts at once
NQ · ES · GC
Each pane picks its own contract and timeframe, down to tick charts, with its own levels.
The macro read
MACRO
Macro, bias, order flow and structure for each contract, and how many of the four agree.
GEX levels + VWAP
Gold
GC · 15M
Mapped from GLD options, with VWAP and its bands.
S&P 500
ES · 5M
Mapped from SPX options, with value area, POC and swing levels.
Nasdaq
NQ · 5M
Mapped from QQQ options, with VWAP and its bands.
FAQ
Questions worth asking.
Put it on your screen tomorrow morning.
Free for seven days. If it does not change how you read the session, cancel and keep the Discord.
Instant access · cancel any time